
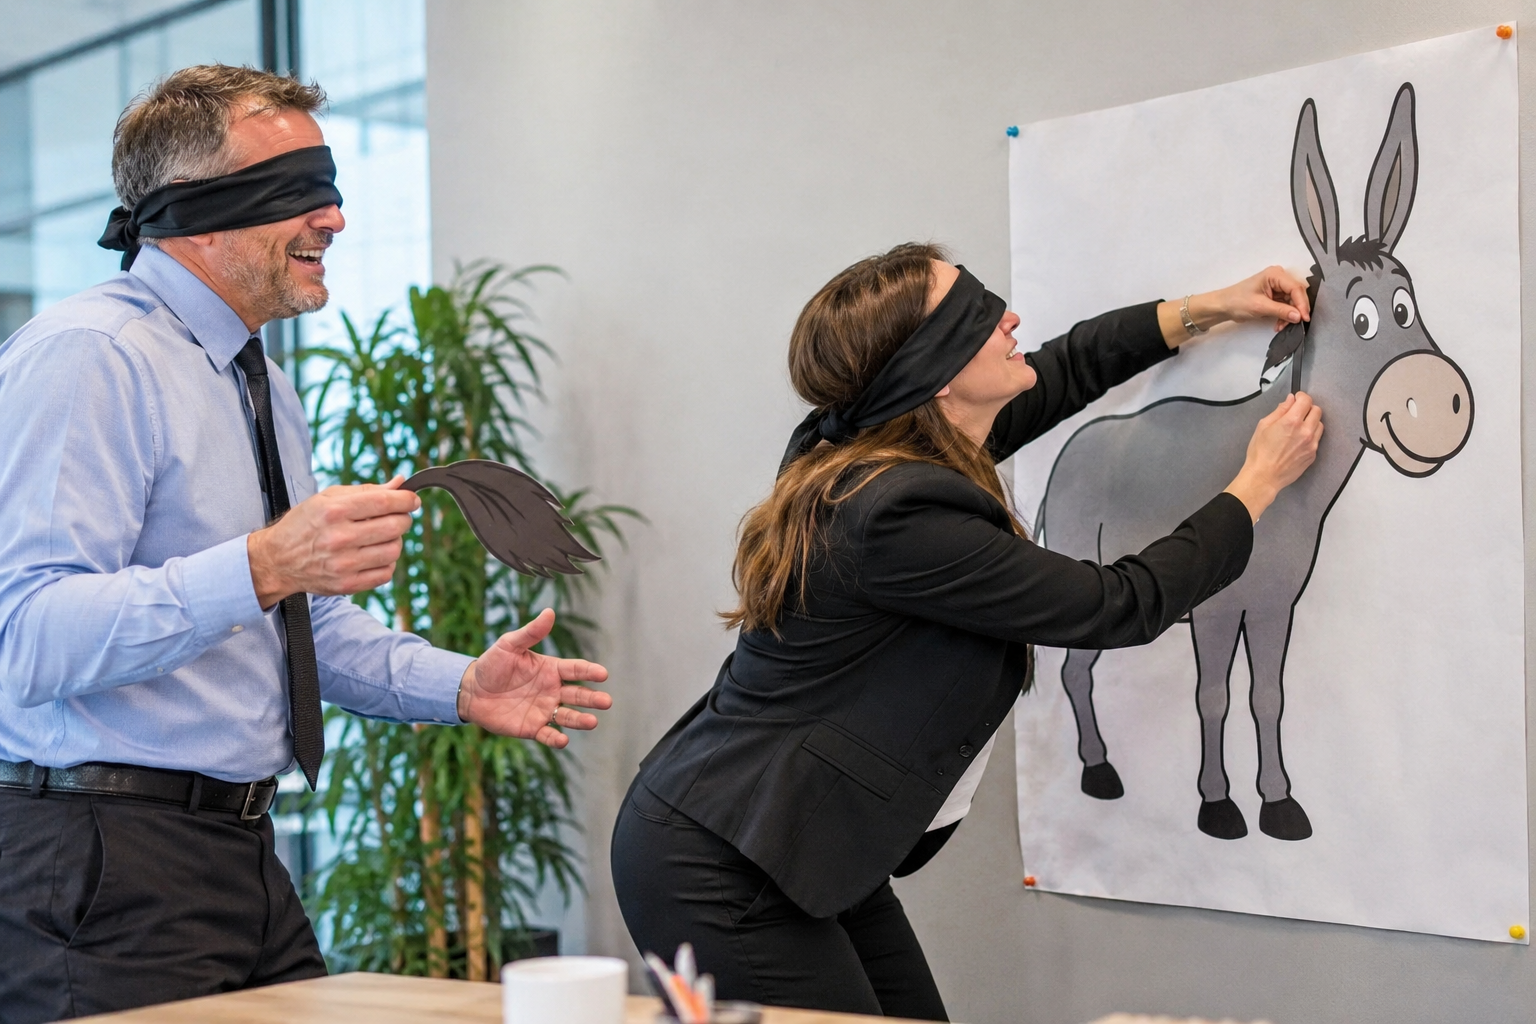
There is an old traditional party game in the UK called Stick the Tail on the Donkey. Quite simple, you have a tail and you have to attach it to the Donkey in its appropriate location (we are not talking real donkeys here) . The complication lies in that the person with the tail is blindfolded.
Online retail penetration in the UK has been increasing since the beginning of the year, settling at 27.8% in June, according to ONS. Clothing & Footwear accounts for the largest share of online sales (27.6%), while non-food goods represent 24.3%.-CBRE
Retail sales per occupied square foot reached a record £61.92 in the second quarter of 2026 up 23% from £50.39 in the final quarter of 2019……retailers are generating significantly more sales from the same amount of shop space ,even as online shopping remains important –The Times- Isabella Fish August 2026
Both statements are correct but paint a different picture.
US inflation stays stable as Fed expected to hold rates -The Times – 27th August 2026
Warsh puts US on alert for Rate Rise – The Times -29th August 2026
UK economic growth — 0.9%, 1.0%, 1.2%… depending on who you ask.
| Organisation | 2026 UK GDP growth forecast |
|---|---|
| OECD, June 2026 | 0.9% |
| IMF, 2026 projection | 1.0% |
| Reuters economist consensus, Aug 2026 | 1.1% |
| Current market/analyst expectations | around 1.1–1.2% |
The difference between 0.9% and 1.2% does not seem a great deal but for the UK economy the difference ie 0.3% equals apporximately £9 billion.
The following table I have taken from asking ChatGPT :
| Subject | Organisation A | Organisation B / later figure | Difference | Why it differs |
|---|
| 1 | 🇬🇧 UK GDP growth 2026 | OBR: 1.1% | IMF: 1.0% | 0.1 pp | Different forecasting dates/assumptions |
| 2 | 🇬🇧 UK GDP growth 2026 | Bank of England: 0.9% | OBR: 1.1% | 0.2 pp | Different models/assumptions |
| 3 | 🇬🇧 UK inflation 2026 | OBR: 2.3% | IMF: 3.2% | 0.9 pp | Very different assumptions about inflation/energy |
| 4 | 🇬🇧 UK migration | ONS: -17,000 | Revised ONS: -114,000 | 97,000 people | ONS changed methodology |
| 5 | 🇬🇧 UK productivity | ONS LFS measure: +2.3% | ONS RTI measure: +4.2% | 1.9 pp | Completely different data sources |
| 6 | 🇬🇧 UK public borrowing | ONS: £129bn | OBR forecast: £132.7bn | £3.7bn | Forecast vs emerging actual |
| 7 | 🇬🇧 UK GDP | ONS early estimate | Later revised estimate | ~0.1 pp per quarter | National accounts are revised |
| 8 | 🇺🇸 US GDP Q2 2026 | Atlanta Fed GDPNow: 1.5–1.7% | BEA: 1.5% | Small by final estimate | Nowcast changes as data arrives |
| 9 | 🇺🇸 US GDP 2026 | OECD: ~2.0% | IMF: 2.4% | 0.4 pp | Different economic models |
| 10 | 🇺🇸 US GDP | Fed median: 2.2% | IMF: 2.4% | 0.2 pp | Different assumptions |
| 11 | 🇺🇸 US employment | Payroll survey says jobs growing | Household survey: 1.37m fewer employed in 2026 | Huge | They measure different things |
| 12 | 🇺🇸 US employment | BLS original estimate | BLS benchmark revision: -79,000 jobs | 79,000 | Administrative data subsequently available |
| 13 | 🇪🇺 Eurozone GDP 2026 | ECB: 0.8% | IMF: 1.1% | 0.3 pp | Different assumptions/dates |
| 14 | 🇪🇺 Eurozone inflation 2026 | ECB: 3.0% | OECD: 2.8% | 0.2 pp | Different forecasts |
| 15 | 🇪🇺 Eurozone inflation | ECB baseline: 3.0% | ECB severe scenario: 4.0% | 1.0 pp | Same organisation, different assumptions |
The exercise , in itself , I find of significance as we are now asking a third party to look at the same data. In this case the original sources are highlighted as are the reason for variations. Hence relatively easy to check and verify. You would think.
Perhaps an even more significant statistic concerning UK productivity since 2019 .One measure puts it at 4.3% another 2.9%.
The UK statistics authority has ordered the Office for National Statistics to take urgent steps within the next four weeks to “restore confidence” in its data after a catalogue of failings.
The head of the House of Commons Treasury committee, meanwhile, has warned that key economic decisions risk being “built on sand” due to a lack of trust in official data produced by the Office for National Statistics. The Times 12th August 2026
This is all very technical stuff and does not affect us. Or rather it does but we have little control of these numbers and what we do with them . We have to rely on Governments to use their infinite lack of wisdom in how they are used and interpretated. In their defence they have to rely on statistical forecasts to develop policy good or bad. Small variances have huge impacts.
August 2026 -Lloyds(UK’s largest mortgage lender) House prices fell 0.6%- August 2026 Santader House Prices rose 1.6%
That’s all super fancy stuff, which whilst hugely important has no real connection to those who matter most …Ordinary people. A number which is very relevant to everyday life but often misunderstood and that is inflation . A headline figure is announced for a period ( generally a month in most economies) let us say it is 4%. Three months later the Government ( in the case of the UK the Bank of England) announces it has fallen to 2% . Wow, Great, Super, aren’t we great …. says the Government of the day believing that the general populace will perceive prices have fallen, as opposed to prices still rising only a touch slower and that they have risen 2% on top of the 4% . I know it is not a straight 4+2 but thats another numbers game. Plus consider there are two measures of Infaltion in the UK, RPI and CPI (there is another variation CPIH which is similar to RPI.). Are we still all here ?
A few everyday numbers that would confuse Martians(and others):
- Technically a football match is a game of 2 x 45 minute halves. It very rarely is.
- In cricket there are 6 balls in every over, unless there 7 or maybe 8 in extreme 9 (wides, no balls etc) . That confuses most earthlings who dont understand cricket , which is most earthlings.
- Does anyone really understand APR ?
- Pi- this may not be true, Martians may understand Pi.
- Car manufacturers fuel/Electric consumption claims.
- Why do Americans weigh things in Cups ?
- The human body contains approximately 60,000 (100,000 km) miles of veins,capillaries and arteries.
- Averages. The problem with an average is that it can be very misleading. For example, if you have a group of 6 children, three are 2 years old and three are 10 years old , the average would be 6 . Yet there are no 6 year olds in the group.
- BMI – a very poor use of averages. Martians do understand this as they are very thin but incredibly dense enabling them to remain grounded even in the most hostile of antigravitational environments
- FTP – Functional threshold power. The measurement of power generated by a cyclist
- Add 0 to a number and the number remains the same ie 0+1=1. Multiple 1 by 0 and 1 disappears
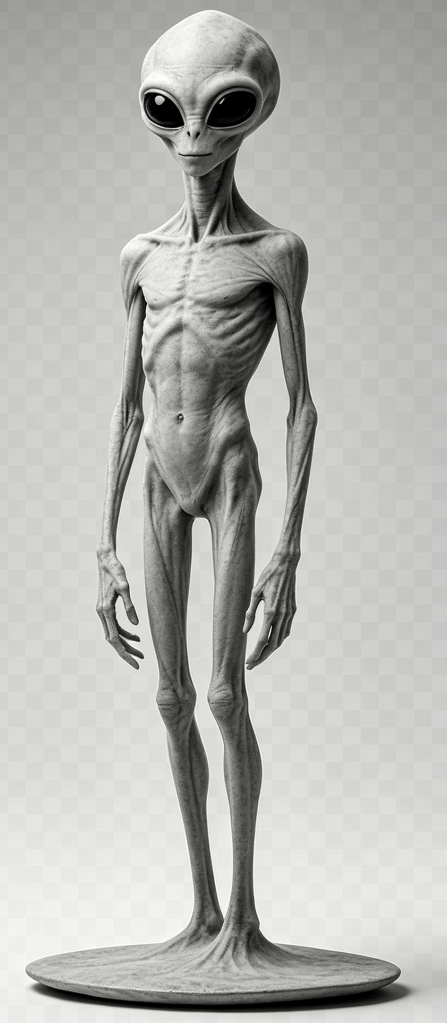
A Very Thin Martian with High BMI
It is very easy to write a ad infinitum about numbers. It is also very easy just to copy and paste relevant and not so relevant book loads of extraordinary stats. But that is not the point, plus it would be very boring. It would also be very easy to quote clearly false and completley fake numbers, as oft quoted by our World Leader of renown and apparently (according to him) extraordinary high IQ, and by others who should know better.
The point (or at least my point) is that everything around us including nature,is affected by numbers and more importantly mathematics (which of course is jsut numbers all jumbeld so most of us cannot understand them).
Concentric Circles in Nature:
Concentric means the circles all share the same center, but have different radii. This means the circles are all different sizes, one inside the other.A common example is in the ripples of a pond when something hits the surface of the water. But we also see concentric circles in the layers of an onion and the rings of trees that form as it grows and ages. mathgeekmama.com
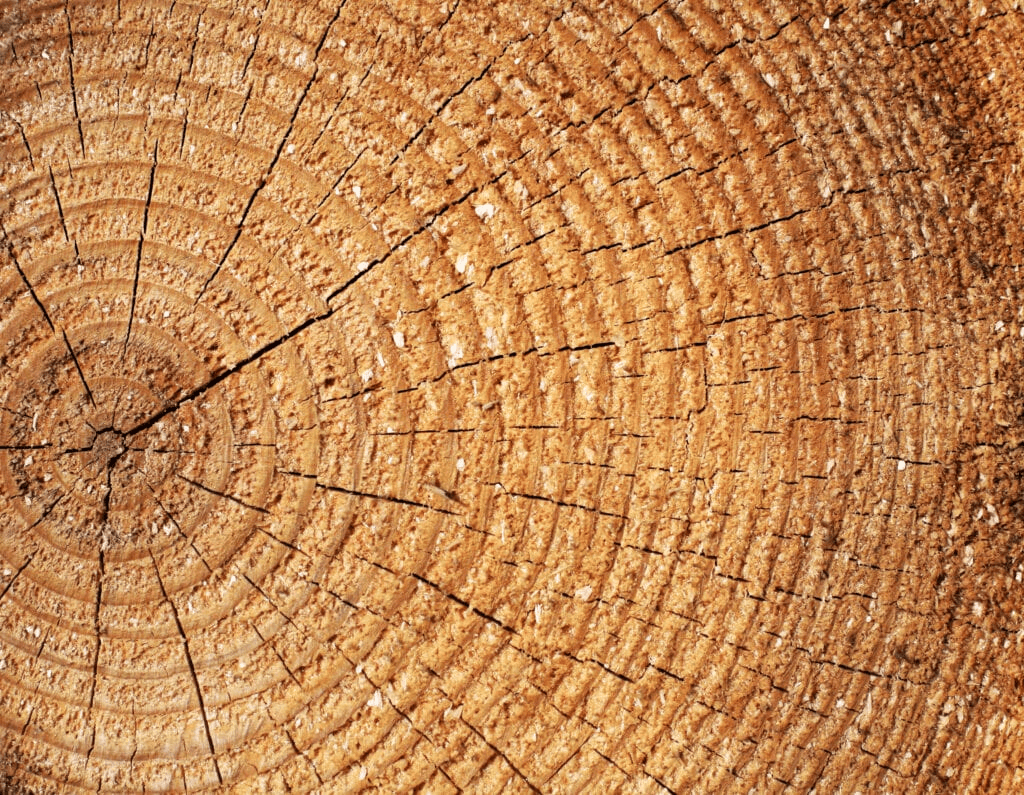
Concentric Circles in Timber
Yet to most of us numbers are confusing at best and completely misunderstood at worst. The numbers are often correct but they are easily misinterpreted or misleading. Julia(my wife) has a form of Dyscalculia. She can add, she can muliply and divide , but when asked to do all three even with a relatively simple string of numbers, she gets panicky .
Every which way, all major organisations, private and public are driven by numbers. Small inaccuracies, or very minor miscalculations at that level have huge consequences. For the individual, even small numbers eg 0.025% can impact big time on your metaphoric wallet when looking at your mortgage statement.
As individuals, frequently there are those that read numbers and stats through rather foggy lenses. They are happy to accept official numbers when they align with their beliefs but choose to ignore or quote the infamous ‘fake news’ when they don’t.
Many go through life afraid of numbers and upset by numbers. They would rather amble along through life miscounting, miscalculating and, in general, mismanaging their worldly affairs than make friends with numbers.
— Shakuntala Devi-Popularly known as the ‘Human Computer’
“A good decision is based on knowledge, and not on numbers.” ~ Plato
Two very different views on numbers. For those that have not heard of Shakuntala Devi. Amongst her many achievements was calculating 23rd root of a 201-digit number in 50 seconds. It took the US Bureau of Standards Computer (with a specailly written program) 62 seconds to verify. Apparently she had no formal education.
Clearly numbers and stats are not only fundamental to life on earth they are critical . What we aren’t very good at is being critical in our analysis as to what the number (or stat) actually means and where that data comes from.
I have probably ‘over quoted‘ as it can be quite annoying and a little lack of imagination and lazy by the author (me) but I came across this one by a Principal Researcher at Mircosoft and it sort of sums up where are and that our interpretations sometimes equate to thinking that a Donkey can grow a tail anywhere on its body.
Data and data sets are not objective; they are creations of human design. We give numbers their voice, draw inferences from them, and define their meaning through our interpretations.
— Kate Crawford