
Stats, Numbers, forecasts…Where do you get your’s from?…

There is an old traditional party game in the UK called Stick the Tail on the Donkey. Quite simple, you have a tail and you have to attach it to the Donkey in its appropriate location (we are not talking real donkeys here) . The complication lies in that the person with the tail is blindfolded.

A blindfolded man holds a tail while laughing, as a blindfolded woman affixes a paper piece to a cartoon donkey on a wall in a modern office setting.

Both statements are correct but paint a different picture.

US inflation stays stable as Fed expected to hold rates -The Times – 27th August 2026

Warsh puts US on alert for Rate Rise – The Times -29th August 2026

UK economic growth — 0.9%, 1.0%, 1.2%… depending on who you ask.

Organisation2026 UK GDP growth forecast
OECD, June 20260.9%
IMF, 2026 projection1.0%
Reuters economist consensus, Aug 20261.1%
Current market/analyst expectationsaround 1.1–1.2%

The difference between 0.9% and 1.2% does not seem a great deal but for the UK economy the difference ie 0.3% equals apporximately £9 billion.

The following table I have taken from asking ChatGPT :

SubjectOrganisation AOrganisation B / later figureDifferenceWhy it differs
1🇬🇧 UK GDP growth 2026OBR: 1.1%IMF: 1.0%0.1 ppDifferent forecasting dates/assumptions
2🇬🇧 UK GDP growth 2026Bank of England: 0.9%OBR: 1.1%0.2 ppDifferent models/assumptions
3🇬🇧 UK inflation 2026OBR: 2.3%IMF: 3.2%0.9 ppVery different assumptions about inflation/energy
4🇬🇧 UK migrationONS: -17,000Revised ONS: -114,00097,000 peopleONS changed methodology
5🇬🇧 UK productivityONS LFS measure: +2.3%ONS RTI measure: +4.2%1.9 ppCompletely different data sources
6🇬🇧 UK public borrowingONS: £129bnOBR forecast: £132.7bn£3.7bnForecast vs emerging actual
7🇬🇧 UK GDPONS early estimateLater revised estimate~0.1 pp per quarterNational accounts are revised
8🇺🇸 US GDP Q2 2026Atlanta Fed GDPNow: 1.5–1.7%BEA: 1.5%Small by final estimateNowcast changes as data arrives
9🇺🇸 US GDP 2026OECD: ~2.0%IMF: 2.4%0.4 ppDifferent economic models
10🇺🇸 US GDPFed median: 2.2%IMF: 2.4%0.2 ppDifferent assumptions
11🇺🇸 US employmentPayroll survey says jobs growingHousehold survey: 1.37m fewer employed in 2026HugeThey measure different things
12🇺🇸 US employmentBLS original estimateBLS benchmark revision: -79,000 jobs79,000Administrative data subsequently available
13🇪🇺 Eurozone GDP 2026ECB: 0.8%IMF: 1.1%0.3 ppDifferent assumptions/dates
14🇪🇺 Eurozone inflation 2026ECB: 3.0%OECD: 2.8%0.2 ppDifferent forecasts
15🇪🇺 Eurozone inflationECB baseline: 3.0%ECB severe scenario: 4.0%1.0 ppSame organisation, different assumptions

The exercise , in itself , I find of significance as we are now asking a third party to look at the same data. In this case the original sources are highlighted as are the reason for variations. Hence relatively easy to check and verify. You would think.

Perhaps an even more significant statistic concerning UK productivity since 2019 .One measure puts it at 4.3% another 2.9%.

This is all very technical stuff and does not affect us. Or rather it does but we have little control of these numbers and what we do with them . We have to rely on Governments to use their infinite lack of wisdom in how they are used and interpretated. In their defence they have to rely on statistical forecasts to develop policy good or bad. Small variances have huge impacts.

August 2026 -Lloyds(UK’s largest mortgage lender) House prices fell 0.6%- August 2026 Santader House Prices rose 1.6%

That’s all super fancy stuff, which whilst hugely important has no real connection to those who matter most …Ordinary people. A number which is very relevant to everyday life but often misunderstood and that is inflation . A headline figure is announced for a period ( generally a month in most economies) let us say it is 4%. Three months later the Government ( in the case of the UK the Bank of England) announces it has fallen to 2% . Wow, Great, Super, aren’t we great …. says the Government of the day believing that the general populace will perceive prices have fallen, as opposed to prices still rising only a touch slower and that they have risen 2% on top of the 4% . I know it is not a straight 4+2 but thats another numbers game. Plus consider there are two measures of Infaltion in the UK, RPI and CPI (there is another variation CPIH which is similar to RPI.). Are we still all here ?

A few everyday numbers that would confuse Martians(and others):

  • Technically a football match is a game of 2 x 45 minute halves. It very rarely is.
  • In cricket there are 6 balls in every over, unless there 7 or maybe 8 in extreme 9 (wides, no balls etc) . That confuses most earthlings who dont understand cricket , which is most earthlings.
  • Does anyone really understand APR ?
  • Pi- this may not be true, Martians may understand Pi.
  • Car manufacturers fuel/Electric consumption claims.
  • Why do Americans weigh things in Cups ?
  • The human body contains approximately 60,000 (100,000 km) miles of veins,capillaries and arteries.
  • Averages. The problem with an average is that it can be very misleading. For example, if you have a group of 6 children, three are 2 years old and three are 10 years old , the average would be 6 . Yet there are no 6 year olds in the group.
  • BMI – a very poor use of averages. Martians do understand this as they are very thin but incredibly dense enabling them to remain grounded even in the most hostile of antigravitational environments
  • FTP – Functional threshold power. The measurement of power generated by a cyclist
  • Add 0 to a number and the number remains the same ie 0+1=1. Multiple 1 by 0 and 1 disappears

A Very Thin Martian with High BMI

It is very easy to write a ad infinitum about numbers. It is also very easy just to copy and paste relevant and not so relevant book loads of extraordinary stats. But that is not the point, plus it would be very boring. It would also be very easy to quote clearly false and completley fake numbers, as oft quoted by our World Leader of renown and apparently (according to him) extraordinary high IQ, and by others who should know better.

The point (or at least my point) is that everything around us including nature,is affected by numbers and more importantly mathematics (which of course is jsut numbers all jumbeld so most of us cannot understand them).

Concentric Circles in Timber

Every which way, all major organisations, private and public are driven by numbers. Small inaccuracies, or very minor miscalculations at that level have huge consequences. For the individual, even small numbers eg 0.025% can impact big time on your metaphoric wallet when looking at your mortgage statement.

As individuals, frequently there are those that read numbers and stats through rather foggy lenses. They are happy to accept official numbers when they align with their beliefs but choose to ignore or quote the infamous ‘fake news’ when they don’t.

Two very different views on numbers. For those that have not heard of Shakuntala Devi. Amongst her many achievements was calculating 23rd root of a 201-digit number in 50 seconds. It took the US Bureau of Standards Computer (with a specailly written program) 62 seconds to verify. Apparently she had no formal education.

Clearly numbers and stats are not only fundamental to life on earth they are critical . What we aren’t very good at is being critical in our analysis as to what the number (or stat) actually means and where that data comes from.

I have probably ‘over quoted‘ as it can be quite annoying and a little lack of imagination and lazy by the author (me) but I came across this one by a Principal Researcher at Mircosoft and it sort of sums up where are and that our interpretations sometimes equate to thinking that a Donkey can grow a tail anywhere on its body.

Encumbered by Numbers !

  • 5.25% Current UK Bank rate (August 2023)
  • 7.9% UK inflation rate (June 2023)
  • 2.9% drop in house prices in the UK (July 22 -July 23)
  • 2.25 % Bank of England May 2022 forecast for Bank Rate May 2023
  • 96% of GDP to 267% in 50 years’ time in 2071/72 (UK Office Office of Budget Responsibility)Net debt as a share of GDP rising – When has any UK Government- probably includes any western democracy- been interested in anything longer than the next General election
  • $300 trillion Global debt(December 2022 -World Economic Forum) (US accounts for just over 10%)
  • £0.70p average price of a pint of milk in the UK August 2023 (Office of National Statistics)
  • 1.5% increase in UK Retail sales July 2023
  • 1.9% increase in UK Retail footfall (same period)
  • 3 in November -The age of our Dog Ari
  • 384 – BC the year Aristotle was born
  • 7000 – the number of trade prices I am supposed to remember (or so think some of my customers)
  • 5.6 million -number Airbnb listings worldwide
  • 7.9 billion -world population 2023
  • 2.3 million US properties underwent foreclosure during the Sub Prime market in the USA between 2007 & 2008
  • -4.1% (note this is a minus figure) China’s deflation figure August 2023
  • 47.8% Turkish inflation rate – July 2023
  • 64 million- number of shipping containers world wide
  • 29 million beef cattle in the US in 2023
  • 20 million penguins on Antartica
  • 392,000 hotel rooms in Spain
  • £84 billion -valuation of Pinduoduo ( owner of Temu latest Chinese market place)
  • 9 million downloads of above Temu app in the U.K. , since launch in the U.K. four months ago (August 2023)
  • 91 indictments faced by Donald Trump
  • 3-1 the odds on Trump winning Presidential election in 2024

The point being….. We are bombarded by numbers every single minute of the day . Most we ignore but most are actually interrelated, and in some way effect all of us either personally, socially or in our working day. All of the above (with maybe the exception of the name of our dog) are interconnected in some way or another . Its a bit like the Chaos Theory of the butterfly that flaps its wings in Tokyo and ends up with a huge storm in the Mediterranean. This may not be an exact hypothesis but hopefully it gives as a reasonable picture as any Mathematical Theory does.

What we have to do is try to unravel those numbers that come to us and we think have an influence on our own businesses .

Unravelling is not an easy task, apart from anything many of those relevant numbers change . Only this week the UK HMRC stated that the tax take for first half of the year was higher than expected . Thus making the public purse look healthier . How so ? Everyone, whether companies, employed or self employed or retired and receiving unearned income, has to make a tax return. That Return determines how much tax is due . So where does all these unexpected tax come from ? Some shady deals where some weird taxpayers want to overpay their tax ? Me think not .

All of a sudden underlying inflation in the UK is dropping quicker than expected , when only last month we were being told it was very stubborn. So if the number makers cant get it right what chance have the rest of us.

My view of numbers is to look at your own. That is is to say if your operation and your customer base is still spending make sure it continues . By that I mean there are many retailers who look at the numbers (cost of living, inflation, media reports ) and think ‘must batten down the hatches‘. This usually involves buying no stock . So as they have no stock , they sell less and are proved right and buy even less. Look at what is happening around you, not what others are telling is happening elsewhere.

The Times August 25/08/2023

Same Newspaper , Same day (they were actually on opposite pages ) 2 very different sets of numbers .

Many a good retailer has told me that an empty hook doesn’t pay your rent . If you can only fill it with product that nets you a penny . That penny is better than nothing . If a customer walks into a store and there is nothing to buy, then that is exactly what will happen. They will buy nothing . But they will go elsewhere and buy that something. I experience empty shelves or hooks virtually everyday . Every empty shelf or empty hook= Potential Lost business and customer.

The media is stuffed full of numbers and most have some form of veracity or at very least they have at a point in time and place. But Context is the critical consideration . How do they relate to my business ? More importantly how do we react to those that are relevant .

If your business is not doing well, it is too easy just to blame it on the cost of living crisis, inflation, or the economic situation . Any one, or all, of those may indeed be the reason but those are not in your control . You can’t effect any of those . There maybe other factors either local conditions or something within your operation that you can affect. If your business is doing well , the very same things apply , but look at why you are doing well and don’t let the negatives alter your course unless there are very direct or obvious reasons for doing so.

Don’t let the Number Encumber ….

The Numbers that Never Add Up……

There are those who may read this and saying I am talking about Statistics not numbers. There are, of course those who will say I am talking utter tosh. They maybe right but if you start any conversation about statistics, the line would go dead (or it would have done when we telephoned each other with telephones) . Anyway what do you work with in statistics , err numbers…If they think I talk tosh i have no counter argument.

During a time when everyone is trying to seek the truth about anything (not that I think finding the truth is anymore difficult than any other time), there is a tendency to believe that if you are given a number in answer to any question then it must be true. 20 divided by 5 = 4. No argument, it is a truth of ‘sorts’ .

One late winter day in 1971, 50 pennies= approx. 20% of £1, the following day, 50 pennies = 50% of £1. What changed ? The numbers in £1(or decimalisation for those who don’t know or can’t remember). So the number 1 did not change but the bits of it did.

A situation oft related is if you take the average wage of those travelling on a particular bus is say £15000 , and then Bill Gates gets on the bus, the average earnings run into billions . So what sort of average is that when only 1 out of say 40 is anywhere close to the average? Now, before I get thumped by someone saying a statistician would always knock of the extremes in any data set, but most of us aren’t statisticians and even then they often have their own interpretations. But we will come back to that .

Blind conviction in decision making that is based on metrics and figures that don’t actually hold up are running rampant

Simon Dutton .Founder of specialist Data Science, Machine Learning & Analytics Development Company

I am not going to even think of using the Damn lies and statistics as it is cliched and not helpful. The reality is the number on its own is a truth . What you do with that number , in what context , how it is interpreted , how it is used and when it is used are only a few of the many variables that can make that number untrue so to speak. The purveyor of the number is the one who needs be questioned .

Playing Bingo, you can be pretty sure the number is what its says on the ball. If the caller says then umber 66 , then that is exactly what it is a truth, you block out 66 on your card. 66 is deemed a ‘truth’.

For me a very simple everyday commercial example would be ……

That is all well and good my good Sir, but you are offering me a discount of 20%. I need a discount of 40% !

My reply

My very fine Customer, that can of course be arranged . But (whispering to myself) I will have to increase the starting price by 20%.

Here’s another….

Well tell me young man (yes some do address me like that), your 100 bestsellers ….

I am sorry no can do…100 bestsellers does not tell you anything . It only tells you what products we sold the most of , at any given time period, that does make them best sellers. There are loads of reason why we have sold a lot but none of may equal a ‘bestseller’ in the true ,meaning of the word

These maybe very simplistic (but true) , however in some different format or any other this type of discussion. it actually happens, a lot. The general answer is discount off what..Most consumers must be fed up to the back teeth of ‘Sales’ with up to 70% off. As far as best sellers are concerned the real numbers are the products that will sell well for the client to whom you are talking .

Off what ?

Everyday life revolves around numbers, our weight, our height,calories, how much we earn and spend , GDP, how much, how many, when, where, who, what , they involve a number somewhere. So you would think we should get them right but in so much of our lives decisions are made where the number is wrong or rather wrong in any one context.

Government Policy is underwritten by numbers (and of course political ideology) . This is directly from the Office for National Statistics(its that word again)

The average family size for women born in 1942 – for example – was 2.29 children per mother. In contrast, their daughters’ generation – represented by women born in 1969 – had on average 1.91 children per mother. Meanwhile, women born in 1984 had fewer children on average (1.02) by their 30th birthday than women born in 1969 – who had 1.12 children by the same age.

ONS 2019

How many women do you know had 1.12 Children ? Or even 1.02 ? In this context none of those numbers are actually real. If you have people in a room and their respective weights are 50kg,51kg,52.5kg,57.8kg,56.25gk, the average weight would be 53.51kg . Yet no one in that room would be the average weight. Within this simple example lies so many issues with health advice, BMI, Calorie intake, healthy weight and absolutely everything that is based upon an average. A male weighing 120kg and 6ft 2″ tall would be considered overweight and unhealthy but not if he plays in the back row for an International Rugby team.

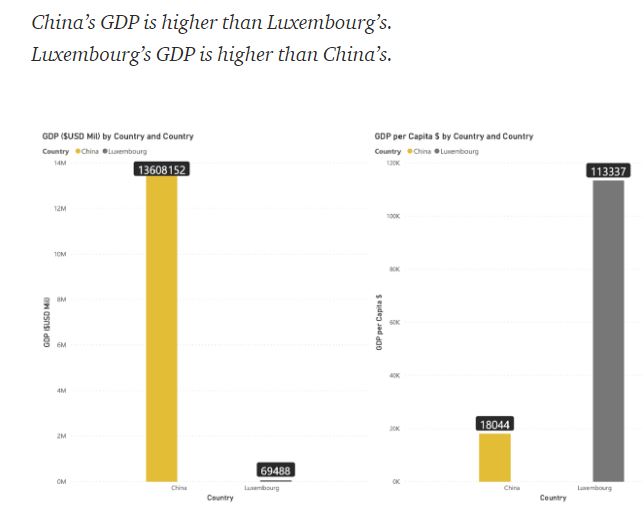
Currently we are being swamped, daily, by numbers relating to Covid 19. More often than not they are used by politicians and journalists alike to make comparisons. Comparing ‘what’ with ‘what’. One set of data from one nation will be totally incomparable to another, as the way the data is sourced will be completely different from each and every nation. This is true of many national stats. Take GDP for example . Whose is the greater China or Luxembourg? Easy you may say….Luxembourg …well it is is if you evaluate it per head !

Simon Dutton .Founder of specialist Data Science, Machine Learning & Analytics Development Company

Single GDP comparisons are in themselves unprecise as mostly they are expressed in Dollars. Dollars like all currencies fluctuate in value. Therefore that value will change depending on what currency that is relevant to you. Example, if you took the UK GDP of the UK in dollars four weeks ago it would have shown one figure but if you translated it today that would have shown GDP growth because of the weakness of the dollar. Yes , I know we don’t measure it in dollars . But international analysts do. What I am trying to say that it is very easy to manipulate the numbers . Of course the numbers don’t manipulate themselves. Much like algorithms, that extraordinary word that implies data lead intelligence. As we are rapidly finding out these wonder ‘rithms‘ don’t create themselves, the data, that they are made up of, comes from us ‘umans . We decide on the numbers that will go into any algorithm, which is why they are often wrong as we discover on a pretty frequent basis.

10,000 steps a day has become the norm for a healthy body. Where did this number come from. It was entirely arbitrary . A Japanese Company company , on the back of the successful Tokyo Olympics, created the world’s first step counter Manpo-Kei , translated it means Ten Thousand Steps. This fabricated number, from a very successful marketing campaign, became the world’s (including the WHO) daily walking benchmark . It was never based on any science.

Advertisement for Manpo-Kei

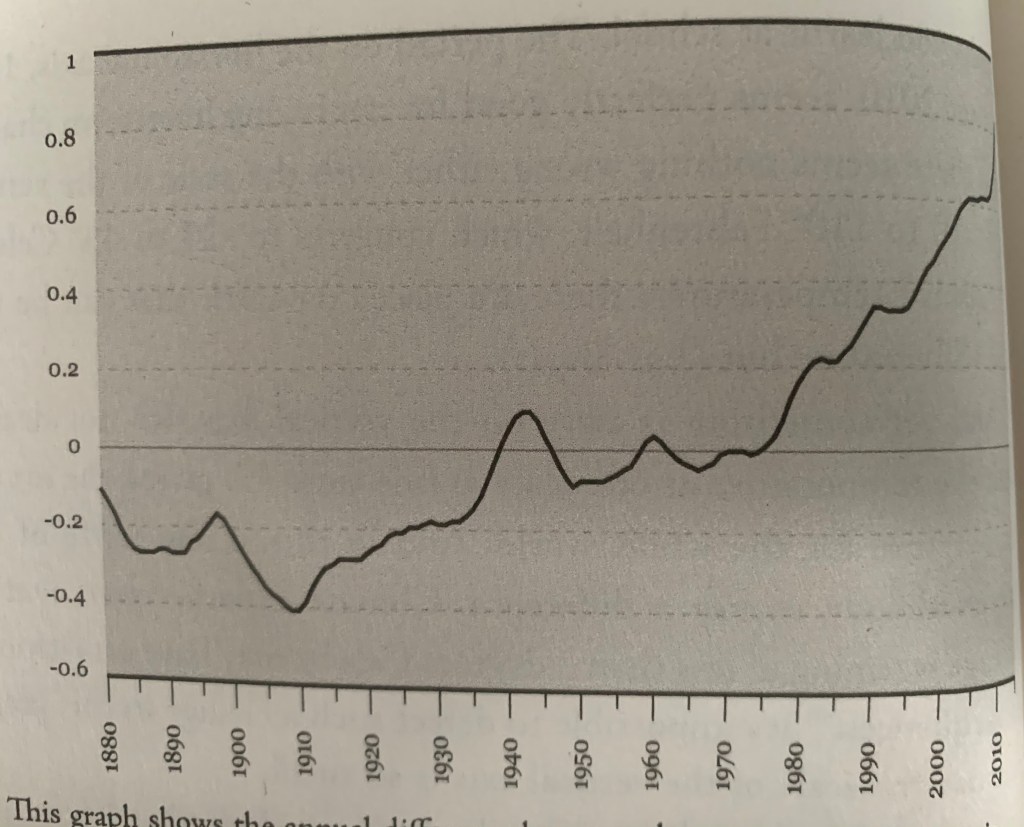
The following two graphs (apologies for quality, tried but failed dismally to replicate them rather more professionally.) Show the same numbers in two very different ways. They measure the change in world climate from 1820-2015. The first one shows the temperature change (Fahrenheit) , as does the second (albeit in centigrade) . However, the second only show the change whereas the first is set against an entire temperature range making the changes appear much smaller. Or depending on your point of view the second illustrating it on a much smaller range !

Both illustrations come from the Book ‘The Number Bias’ by Sanne Blauw

Inflation is measured by all Developed Nation Governments , for a whole bunch of reasons, mainly to do with them , and they are all measured differently . In the UK were are really lucky as we have 2, CPI and RPI. What these both are and why both exist is an other story but essentially they are made from what are lightly called ‘baskets’ Probably there are created by ‘basket cases’ (English slang for stupid people) . These baskets are made up from lists of goods and services that we are all supposed to use regularly .

Some of the items are power drills, beers in night club, avocados, raspberries, 65″ TV , women’s gym wear, acoustic guitar, gym equipment and……. To some these may seem very representative of their life but to others will have no relevance what so ever. The inflation number is supposed to be a guide as to what is happening to prices. Yet if you are on the breadline and your rent has just gone up, the bus fare to work(if you have a job) has had a hike, then being told inflation number is only 1% , as fuel has plummeted, as has the price of 65″ TV , is going to mean diddly squat.

So next time a salesperson comes into your business telling you wow i’ve got some great numbers to show you, just be sure exactly who they are great for …

Perfect numbers like perfect men are very rare

René Descartes-Philosopher & Mathematician) (today he would have included women, I think (oh yes, I think, therefore I am….another of his -Descartes that is))